
Fraud Management Dashboard
COURSE: ISE 220. Interaction Design II by Prof. Rosenberg
OBJECTIVE: Design a dashboard for fraud managers of a data analytics company that provides a real-time overview to make proactive decisions and take quick actions.
PROJECT: Individual
DURATION: 6 weeks
YEAR: 2020
UX METHODS: Personas, User Stories, Conceptual Matrix, Information Architecture, Sketches, Wireframes, Rapid Prototyping
TOOLS USED: Axure RP, Adobe Illustrator, Adobe Photoshop
Final Design -
The Final Design was submitted after 6 weeks
The final prototype was presented to the industry reviewer.
Final Working Prototype Link: https://r0jhxj.axshare.com/#id=8xgdkd&p=intro_page
The design helps manager to -
View alerts on critical tasks and management issues
Quick reassignment of resources
Make decisions quickly by the recommendation system
Retrain the “Models” that is not performing well in one click
Dive deep in case details from anywhere
Design Process
01. Design Brief
Project Goals:
Improve the information architecture and overall experience of reviewing operational and statistical data.
Provide quick at a glance analysis with the ability to dive deeper into the data.
Allow the user to make decisions and take action on specific data sets and events.
Before I explain the project further, let me explain the terminologies used frequently and how the system currently works
02. Persona

Janine, Fraud Manager
Typical Workday
She wants to be able to have a real-time overview of the situation and make proactive decisions and take quick actions.
Goals
Proactively run scenarios that consider likely challenges
Wants quick at a glance analysis with the ability to dive deeper into the data
Pain Points
Difficult to get reports to see the “big picture”
Hard to find the data she needs
Reports don’t provide visuals to communicate clearly to upper management
System performance, number of different/disparate systems needed to make a decision
Productivity loss due to inadequate tools and training
Requirements of the project
Janine should be able to -

03. Conceptual Model
The conceptual model framework optimizes the design by having the least amount of screens and more concise navigation flows. A conceptual model incorporates everything we do in the field of user experience to fit the user's mental model (Rosenberg, 2020).
The conceptual model includes Object-Action Matrix, Object Attribute Matrix, and Prioritization Matrix. The conceptual model defines the backbone of the design.


04. Information Architecture
Information Architecture helps in structuring, labeling, and organizing content. It is the art and science of shaping information for usability, findability, and understanding.
I applied 3 types of Information Architecture experiences: Word Design, Browse Interaction and Search Decision
Word Design
Brand Voice : professional, approachable, proactive
Product Voice : straightforward, proactive, guiding, team building, friendly
Tone : reassuring in “error messages”, formal for basic data, “serious tone” in alerts and critical issues, “action oriented” in decision making eg. reassign, retrain, escalate, kudos.
Taxonomy : case, analyst, queue, model
Browse Interaction
The IA Organization : Ambiguous (subjective) scheme: Audience and Chronological
Labeling System : Call to action (reassign, run scenarios, kudos, escalate, export, email, request for re-training), Global (update, search, date picker, notification, profile icon)
Search Decision
The search used in the design will be an unstructured search and will have the key 5 stages:
Formulation : expressing the search
Initiation of Action : launching the request
Review of results : reading / viewing outcome
Refinement : formulating the next step
Use : compiling or taking action
05. Sketches and Explorations
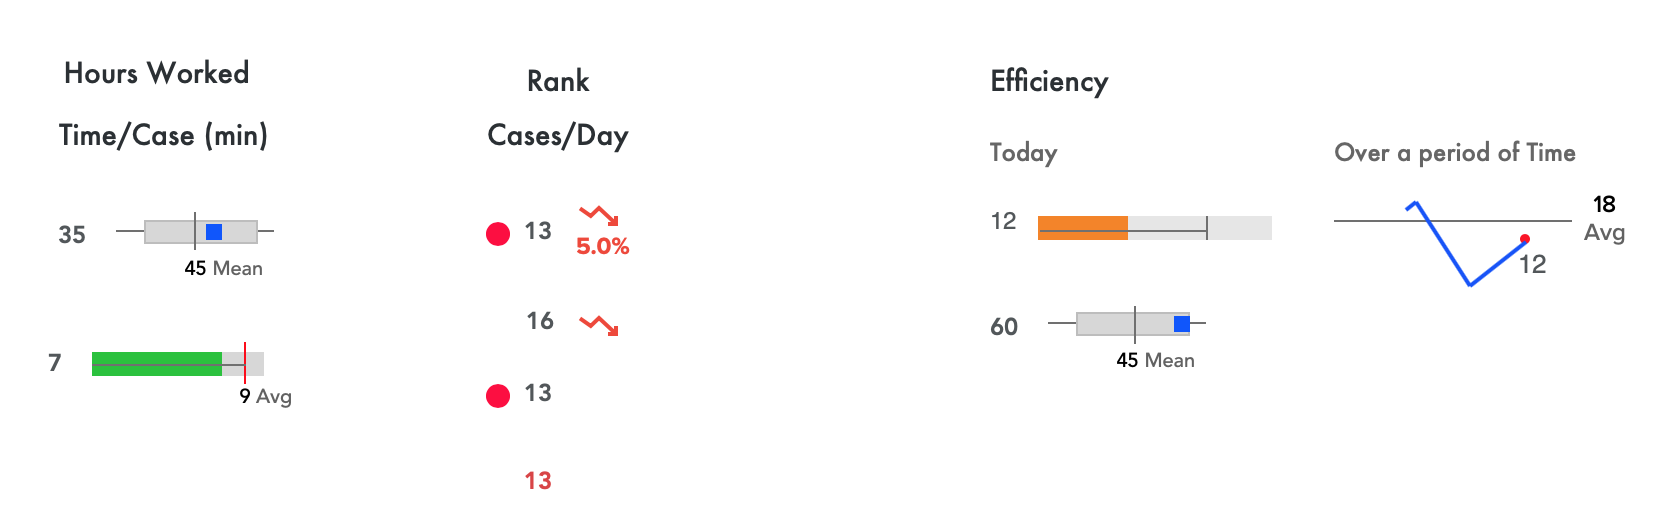
Data Visualization explorations was important to figure out what type of charts to use for different types of data, and how the charts can provide high-level performance overview and help the fraud manager take actions. Various explorations for showing the data in a table
06.Concept
Iteration 1 and Feedback
There was an interim review session on 5th Oct 2020 with our class and I received a lot of detailed feedback on the initial design.


Iteration 2
In the new design:
Poor performers section was given more prominence than the top performers
Cases that need attention were given more priority
Important data for Queue was highlighted on the Overview page.
07. Final Design

Final Working Prototype Link: https://r0jhxj.axshare.com/#id=8xgdkd&p=intro_page
Semantic Grid
Conceptual model is reflected in the layout using semantic grid. The local an global actions and objects placement should reflect in all pages.
Dashboard
Janine can:
View alerts on queues that needs improvement, poor analyst performance, cases that need attention and models that are not performing well.
Can quickly reassign analysts in any queue
Reassign analyst between queues
Request retraining of model that is not performing well
Dive deep quickly in case details
Queues
Janine has to look over three queues.
Each queue has a different number of cases.
Each analyst can be assigned to multiple queues.
For Janine, the following questions are important and should be answered:
- Queue Performance (cases/hr). Which Queue is performing well and which one is performing poorly?
- Efficiency (min/case). Whats the average working time for each case? How long is the case taking to be closed?
- Analyst Workload: What is the ratio of number of Cases to the number of Analysts? If it is high, the fraud manager needs to assign more analyst to the Queue.
-Open Cases: Open Cases are cases which have been assigned to the analyst but have not been worked on. High Open cases means that the Queue is not working properly.
Reassign Analysts in Quality Control Queue
The system recommends the action that Janine should take for optimal performance of the Queue.
The system presents top analysts that are available to be added to the Queue.
The system also shows poor-performing analysts already assigned to the queue.
The ultimate decision is in the hands of Janine.
Analyst Page
Janine is quickly informed about Poor performing analysts and Top performing analysts.
Janine can:
- Reassign Analysts to Queues
- Sort analysts on the basis of Cases/Day, Time/Case, Hours worked, Total Cases Working and Rank
- Filter out analysts by Queue Type, case Type, Case Status, Case Level, Model Used, Tenant
Reassign Analyst to one or more Queues
Janine wants to reassign the analyst named Jane who is part of the Quality Control Queue. Clicking on Reassign button besides Jane’s profile will open this popup window.
Janine (fraud manager) can view the forecast of the Queue performance for all the Queues.
The system predicts a positive impact for High-Risk Customer and Top Priority Queue if Jane is added to the Queue.
It also predicts a negative impact on Quality Control Queue if Jane is removed from that Queue
Model
There are 4 models that are actively monitoring potential fraud cases.
For Janine, the important tasks are to:
Monitor the FRP (False positive rate) of the model to determine if it's working properly.
Report the poor-performing model to the IT department by “requesting to Re-Train the model.”
Final Feedback and Conclusion
The final prototype received positive feedback from the external reviewers. Professor Rosenberg’s feedback was:
“Overall – very solid job”
The project taught me:
How to approach a complex project with a huge data in Excel.
Filtering crucial data from the given data.
The significance of data visualization in reducing cognitive load when dealing with large amount of data.
Importance of cross functionality while designing task flows.
