

Fraud Management Dashboard
The project objective is to design a dashboard for fraud managers that would enable them to make proactive decisions. This is a University-industry cooperation project, with real-world data provided by our partnered company.
MY ROLE: This was an individual project.
CLASS: Class: ISE 220 Interaction Design II by Prof. Rosenberg
YEAR: 2020
DURATION : 8 weeks
TOOLS USED : Axure, Adobe Illustrator, Adobe Photoshop,
UX METHODS: Personas, User Stories, Conceptual Matrix, Information Architecture, Sketches, Wireframes, Rapid Prototyping
Final Design and Prototype Link
Link for the Final Prototype: https://r0jhxj.axshare.com/#id=8xgdkd&p=intro_page
Design Process

01. Design Brief
ACME and the Phoenix Platform
ACME ( partnered company’s name cannot be disclosed) is a San Jose based decision analytics company with offices around the world.
ACME is in the process of developing a new platform for Phoenix to provide innovative new features and wants to delight its customers with powerful & intuitive feature.
Phoenix software product is used by ACME to screen transactions and highlight suspicious activities of some of the world’s largest credit card companies.
Project objective
The objective is to improve the experience of fraud managers and senior level workers so that they are able to view how their current fraud strategy (comprised of both people and technology/models) is working and take actions to improve that strategy if needed.
High level project goals are to:
Improve the information architecture and overall experience of reviewing operational and statistical data.
Provide quick at a glance analysis with the ability to dive deeper into the data.
Allow the user to make decisions and take action on specific data sets and events.
Before I explain the project further, lets go through some terminologies and their meaning
Case
A case is created when any account or customer information is compromised or detected to be compromised.

Queues
A queue is a virtual list of cases that have been filtered and ordered using a set of criteria defined as part of a corresponding queue definition. Items in queues are presented to analysts in the group assigned to the queue.

Analyst
Analysts receive cases from their assigned work queues and review the information for signs of fraud.

Model
Models actively monitor the potential fraud cases. Once the case is identified by the model, the system automatically assign it to the queues.
Requirements
Goal #1 — Design the information architecture and overall experience of reviewing operational and statistical data. The information architecture of the dashboard should support:
Search
Filtering the data
Drilling down on the data
Tracking data
Emailing data
Saving data
Exporting to PDF for printing
Goal #2 — Introduce a configurable dashboard based on the role of the logged-in user, the Team Leader/Fraud Manager. Dashboard questions to be answered:
Analyst performance: how fast they are working cases, how many cases had status and what status was - open/active/closed/and how many per hour/day, case type, case level
Queue and queue performance: how fast the queues are being worked, How long they are staying in “active” state before moving to “closed”
Model performance: how well are the models performing (e.g. false positive rate)
02. Persona

Janine, Fraud Manager
Typical Workday
She wants to be able to run different scenarios that allow her to quickly respond to changing customer/applicant behavior, as well as respond to changes in results as new data, becomes available. She scans her inbox constantly for updates and picks up the phone when she has to work her contacts in the company to get what she needs quickly.
Goals
Proactively run scenarios that consider likely challenges
Provide quick at a glance analysis with the ability to dive deeper into the data
The dashboard should be configured to display different data sets based on specific filter criteria
Have the ability to print and email the analysis
Allow the user to take make decisions and take action on specific data sets and events. Examples include sending notifications, escalate to an executive, as well as move analysts around to re-balance the work queues.
Pain Points
Difficult to get reports to see the “big picture”
Hard to find the data she needs
Reports don’t provide visuals to communicate clearly to upper management
System performance, number of different/disparate systems needed to make a decision
Productivity loss due to inadequate tools and training
03. Conceptual Model
The Conceptual Model framework optimizes the design by having the least amount of screens and more concise navigation flows. The conceptual model includes Object-Action Matrix, Object Attribute Matrix, and Prioritization Matrix. The conceptual model defines the backbone of the design.
Object Action Matrix
The goal of the Object Action Matrix is to minimize cognitive load. The Object Action matrix is derived by first identifying objects and actions from the user stories and then refined and made more concise by clubbing similar objects and actions.

Object Attribute with Dimensions and Measure
The tables represent the attributes with dimensions and measures of the four objects - Queue, Case, Analyst, and Model.
Dimensions classify attributes of a particular object into hierarchical, categorical or scalar dimensions.
Measures are numerical values of dimensions and can be raw count or normalized.

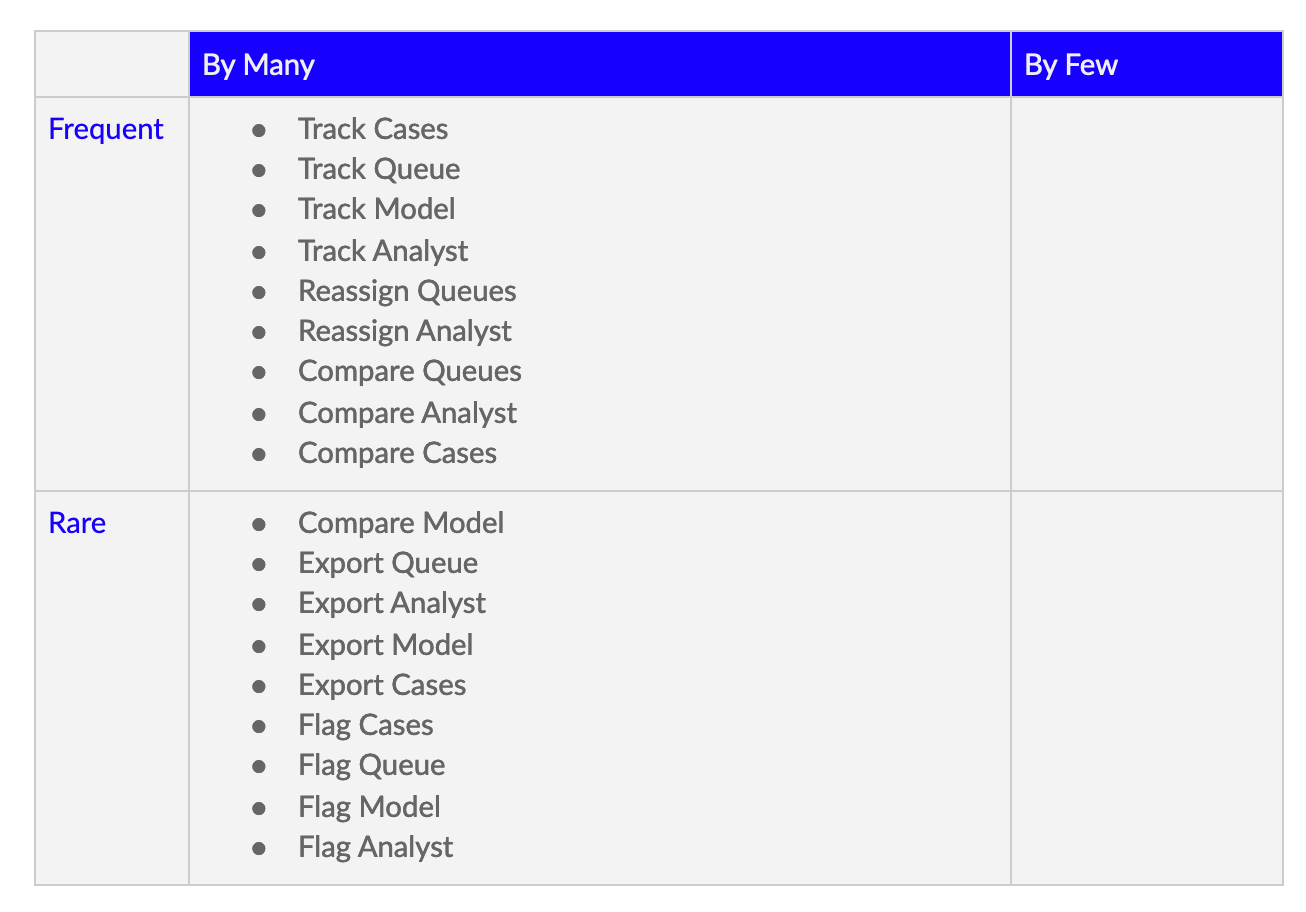
Prioritization Matrix
The Prioritization Matrix helps determine which tasks are important.
The tasks are bucketed in terms of
frequent/rare visits
Number of people viewing it (by many/by few).
The first quadrant (Frequent visits and by many) has the most important tasks. It should have the highest priority with easy access and condensed navigation flows. The Prioritization matrix influences the navigation and flow of the application.
The By Few section is irrelevant in this case as there is only one user ( fraud manager) for this application.
04. Information Architecture
Information Architecture helps in structuring, labeling, and organizing content. The official definition by Rosenfeld, Morville & Arango (4th Edition 2015) of Information architecture is
“ The synthesis of organization, labeling, search, and navigation within digital, physical, and cross-channel ecosystems.” It is the art and science of shaping information for usability, findability, and understanding.
Every user encounters 3 types of Information Architecture experiences: Word Design, Browse Interaction and Search Interaction.

Browse Decision
They include the IA Organization systems, labeling decisions and navigation systems
The IA Organization
Ambiguous (subjective) schemes
Audience ( persona goals or self identify)
Chronological

Search Decision
The search used in the design will be an unstructured search and will have the key 5 stages of Search :
1) Formulation : expressing the search
2)Initiation of Action : launching the request
3) Review of results : reading / viewing outcome
4) Refinement : formulating the next step
5) Use : compiling or taking action
Sort and Filter Decisions
Model
Default Sort : False Positive and High to Low

Analyst
Default Sort : Performance (High to Low)

Queue - Case
Default Sort : Type of case ( Open>Active>Closed) and then duration in each

05.Sketches and Explorations
Data Visualization Exploration
Data Visualization explorations was important to figure out what type of charts to use for different types of data, and how the charts can provide high-level performance overview and help the fraud manager take actions.

Various explorations for showing the data in a table

Exploration to show the status of the case, when it was changed (time) and the analyst who was in-charge during the status

06.Concept
Iteration 1
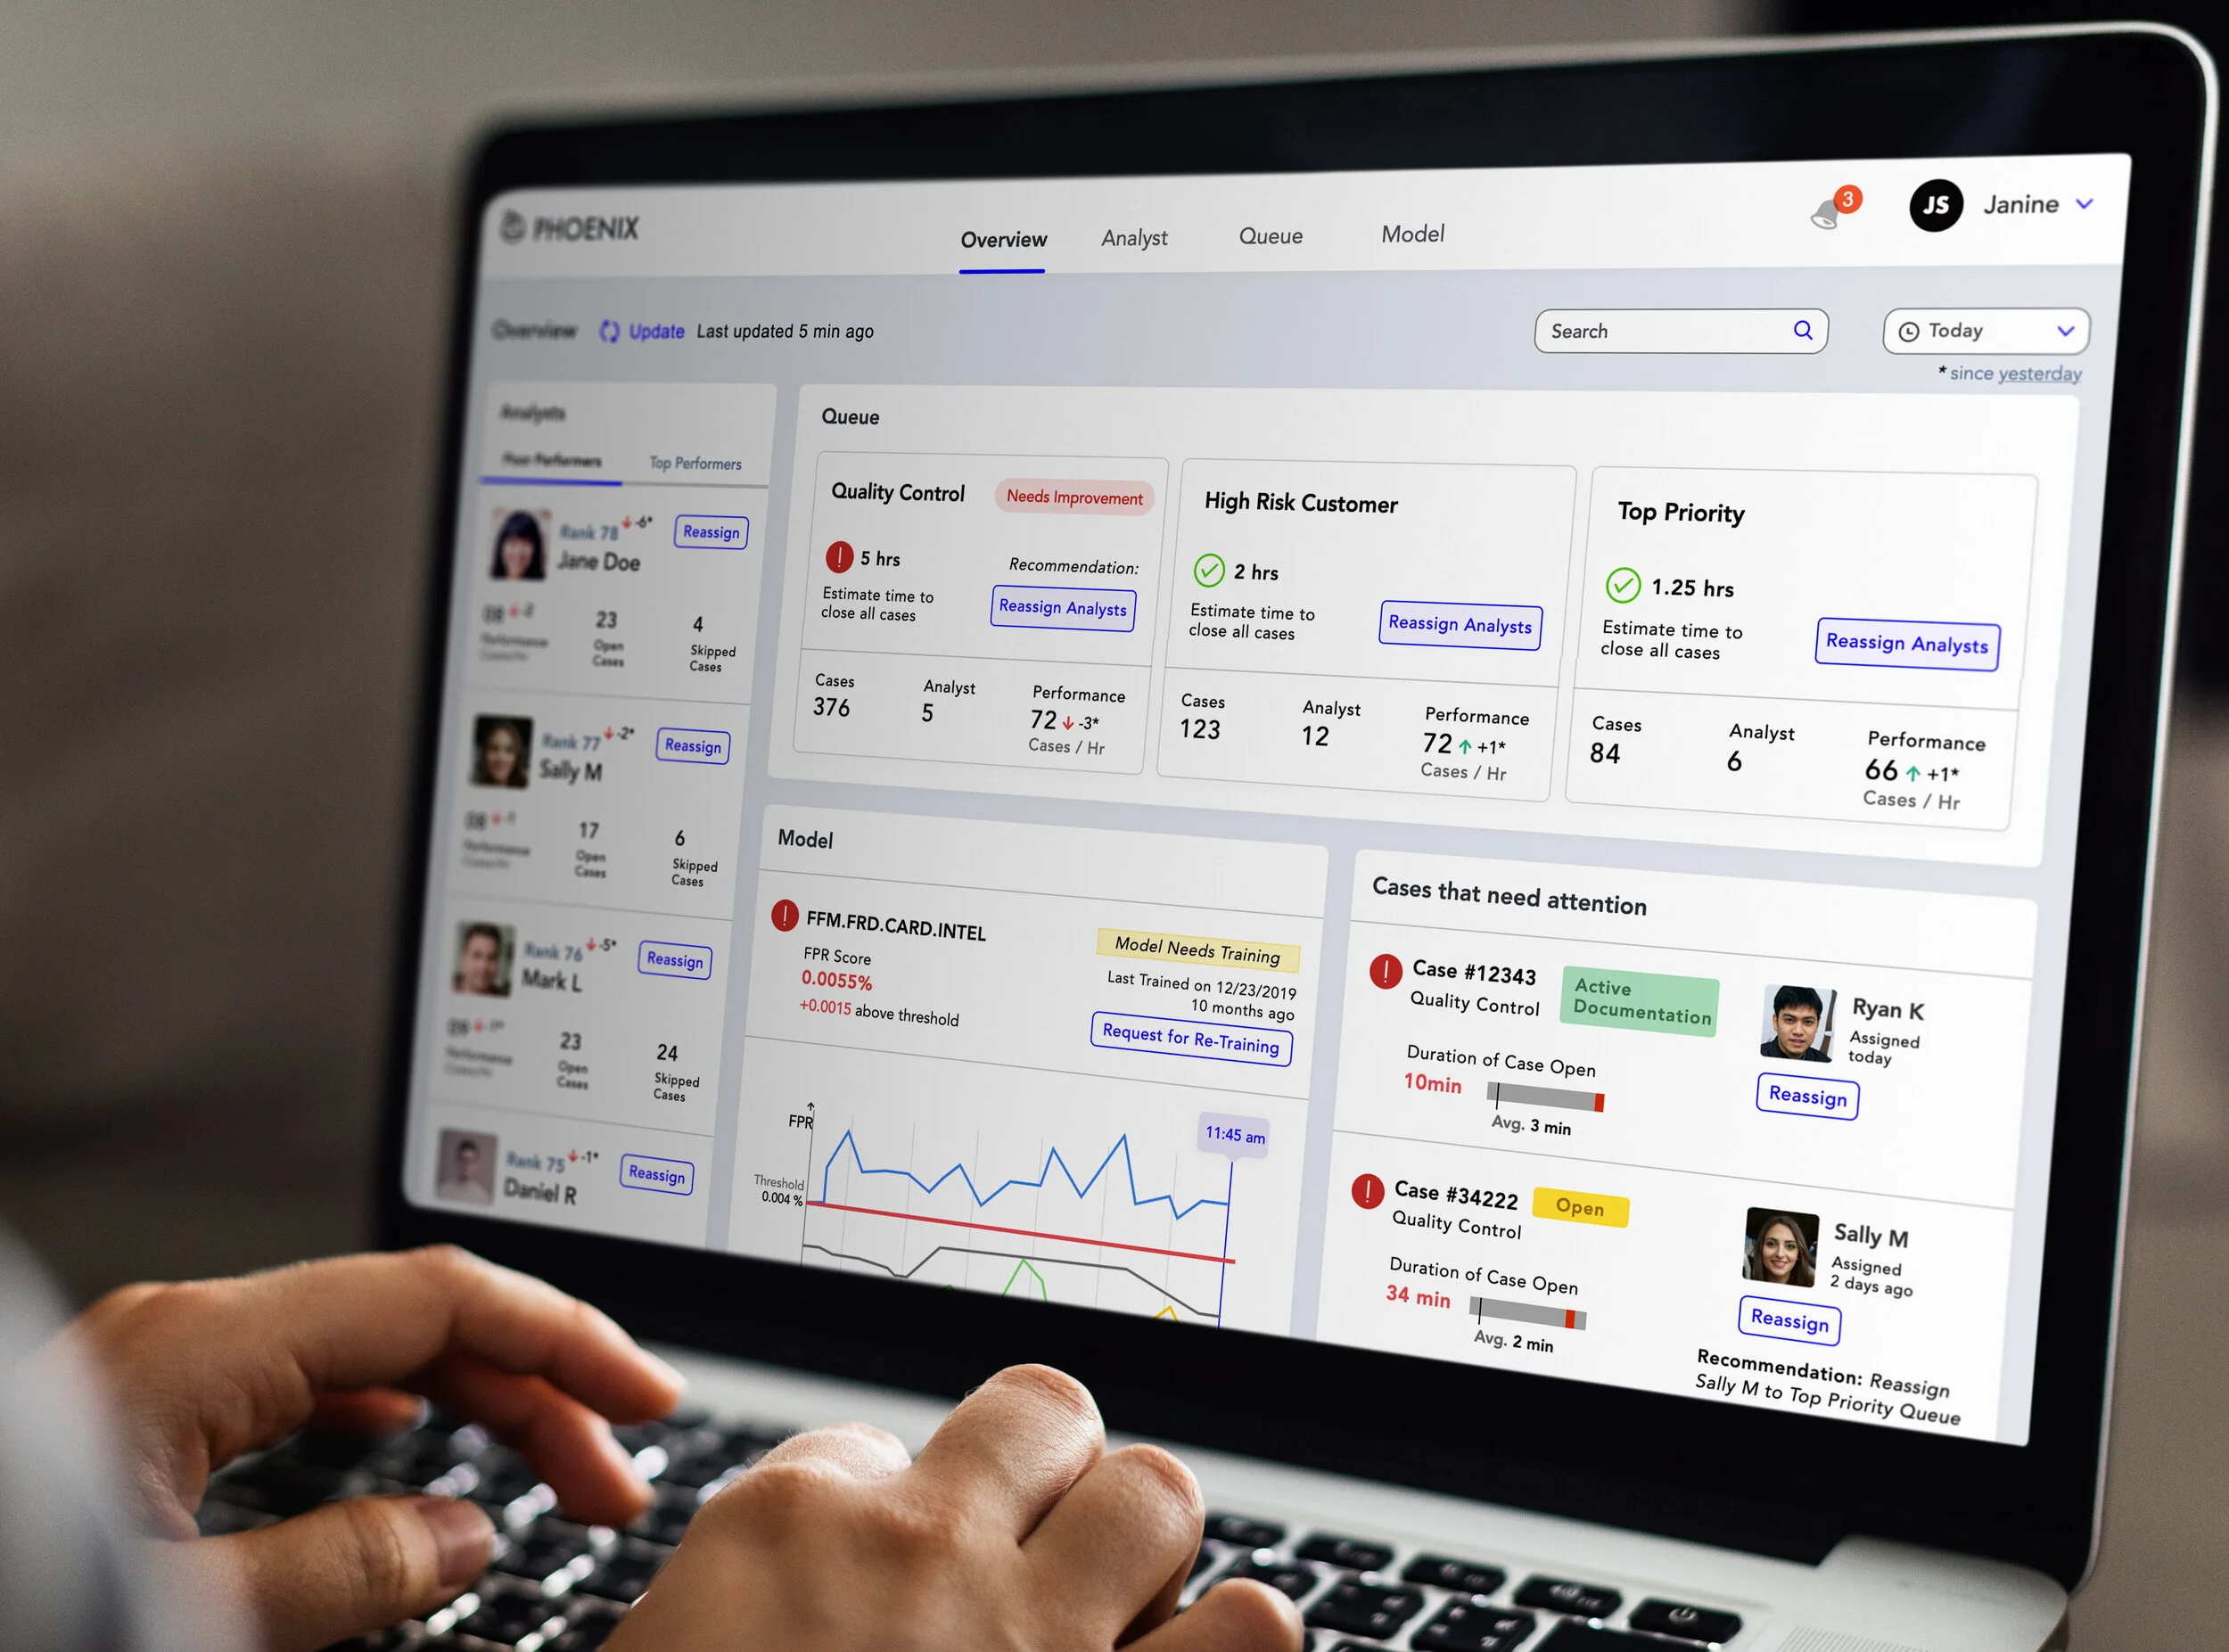
The dashboard overview page will be the landing page of the platform and will provide a high-level overview for quick scan and analysis. The Overview Page will include the Queue, Analysts, Model, and Cases that need urgent attention.
The dashboard design is proactive. It provides recommendations and makes decision making quick and easy for the fraud managers.
Overview Page
Model Page
Analyst Page
Queue Page
Interim Review - Feedback on Iteration 1
There was an interim review session on 5th Oct 2020 with our class and I received a lot of detailed feedback on the initial design.
Feedback from Professor:
Fraud Manager does not train the model so the button “Start Training” needs to change.
Any percentage comparison like 7% increase needs a reference time with which it is being compared.
Add last refreshed on hh:mm(time) with a refresh button
Underline for hyperlink needs to be changed
For Case Details: imp things to consider
When did the state of case change
and which analyst worked on which part
FPR rate will be 0.002 or something this small
The representation of Queue in table is not scalable. Needs a better way of viewing it
Kudos and Reassign buttons don’t need the same weight in terms of visual design.

Changes from Iteration 1
Shown below are some of the design changes that were made to the new design after receiving feedback on Iteration 1.

Iteration 2
In the new design:
Poor performers section was given more prominence than the top performers
Cases that need attention were given more priority
Important data for Queue was highlighted on the Overview page.
Overview Page of the Platform - Ideation 1
Overview Page of the Platform - Ideation 2
Queues
Queue Page
There are three queues (groups). Each queue has a different number of cases. Each analyst can be assigned to multiple queues.
Some important questions to be answered are:
- Queue Performance (cases/hr). Which Queue is performing well and which one is performing poorly?
- Efficiency (min/case). Whats the average working time for each case? How long is the case taking to be closed?
- Analyst Workload: What is the ratio of number of Cases to the number of Analysts? If it is high, the fraud manager needs to assign more analyst to the Queue.
-Open Cases: Open Cases are cases which have been assigned to the analyst but have not been worked on. High Open cases means that the Queue is not working properly.
Breakdown of Queue By:
This section gives an overview of all the queues and their details. It can be filtered by:
Case Status
Case Level
Case Type
Efficiency
Duration per case Status
Case Detail Page
Clicking on any case ID in the Queue or the Overview Page will lead you to the Case Detail Page
The case detail shows the important data of a case like the Queue, Case level, Tenant, Duration, Created on, Closed date, Analysts working on the project.
The most important aspect of the page is:
The breakup of the case timeline in terms of the status.
The analyst responsible for each case status.
The Fraud Manager can also view the comments made by the analysts.
The system shows “Other cases that need attention” in the case detail page, allowing cross navigation and saving the fraud managers time.
Run Scenarios and Reassign Analysts and Queue
Running Scenarios is a big task for Fraud Manager. She can reassign individual analyst to multiple Queues or remove analyst from certain Queues after reviewing their performance. She also needs to evaluate a Queue and reassign one or more analysts so that the Queue performance improves.
Reassign Analyst to one or more Queues
Clicking on the Reassign button beside Jane Doe brings up this screen.
In this screen, the analyst named Jane is part of the Quality Control Queue. Janine (fraud manager) can view the forecast of the Queue performance for all the Queues.
- The system predicts a positive impact for High-Risk Customer and Top Priority Queue if Jane is added to the Queue.
- It also predicts a negative impact on Quality Control Queue if Jane is removed from that Queue.
Reassign Analysts in Quality Control Queue
On the top of the screen, the system recommends the action that Janine (Fraud Manager) should take for optimal performance of the Queue. The system presents top analysts that are available to be added to the Queue. The system also shows poor-performing analysts already assigned to the queue. The ultimate decision is in the hands of Janine.
Analysts
Analyst Page
Janine is quickly informed about Poor performing analysts and Top performing analysts.
Janine can:
- Reassign Analysts to Queues
- Sort analysts on the basis of Cases/Day, Time/Case, Hours worked, Total Cases Working and Rank
- Filter out analysts by Queue Type, case Type, Case Status, Case Level, Model Used, Tenant
Model
Model Page
There are 4 models that are actively monitoring potential fraud cases. Once the case is identified by the model, the system will automatically assign it to the queues.
For Janine, the most important thing is to monitor the FRP (False positive rate) of the model to determine if it's working properly. She can report the poor-performing model to the IT department by “requesting to Re-Train the model.”
Feedback for Iteration 2
In our final review session on 19th Oct 2020, each one of us had to present the design to the external evaluators from the industry. Some of the feedback I received was to:
Reduce the color used in the prototype. Color should be used to highlight only critical information.
Show only essential details of the Queue in the Overview Page.
“*since yesterday” page needs to be mentioned only once at a global level.
07. Final Design
Previous Design - Iteration 2

Final Design - Iteration 3

Semantic Grid


Final Feedback and Conclusion
The final design was submitted 2 days after the final presentation. The design and the prototype received positive feedback.
The project taught me:
How to approach a complex project with a huge data in Excel.
I learnt that not all given data is important when looked at from the persona’s point of view and it is crucial to filter out the data in terms of relevance and importance.
Cross functionality is very important while designing task flows.
The significance of data visualization in reducing cognitive load when dealing with large amount of data.
The final feedback on the submission is yet to come.
